

24 Questions on Extreme Weather, Disasters, and Climate Change
As Seen on PBS Energy Switch
By Patrick Brown
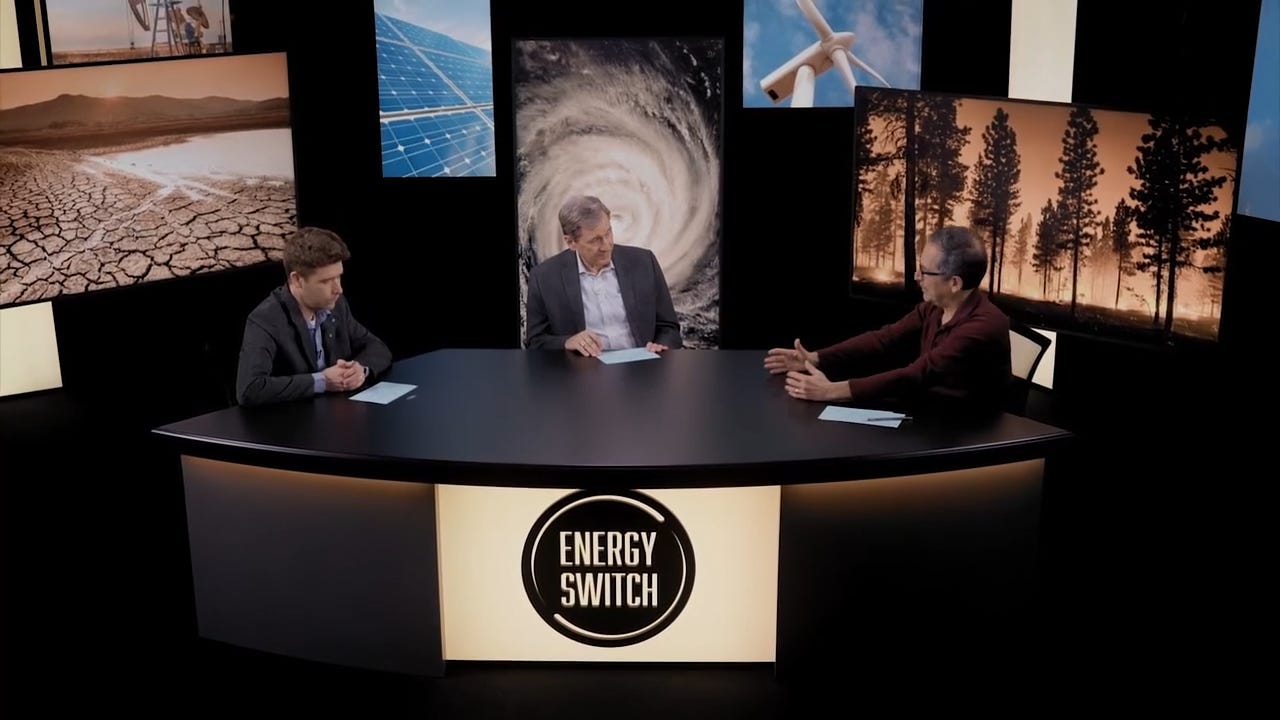
I was recently on two episodes of the PBS show Energy Switch, hosted by Scott Tinker, alongside Andrew Revkin. The topic was extreme weather, disasters, and climate change.
I highlighted that elevated greenhouse gas concentrations, primarily from the burning of fossil fuels, are causing an increase in heatwaves and coastal flooding as well as a decrease in coldwaves. However, global fire activity, global floods, global meteorological droughts, global hurricane activity, global mid-latitude cyclones, and severe thunderstorms (and their subhazards) aren’t changing at nearly the pace (or sometimes even in the direction) many people think.
Meanwhile, climate-sensitive outcomes, such as per capita deaths from extreme weather or damage per dollar exposed, have declined over time due to economic and technological development. That also means that outcomes from extreme weather today are dictated much more by societal arrangements and background economic development than by the severity of the hazard itself.
I think there’s a huge gap between what you’d read in the IPCC Working Group 1 chapter on extreme weather and what you see in a lot of media.
What is put in front of our eyeballs is largely Earth’s pre-existing extreme weather hazards interacting with vastly increased exposure over time and then disseminated to us much more efficiently than ever before through the internet and algorithms. Additionally, a major part of the perception is that activists in the climate movement have found it very useful to connect extreme weather to elevated greenhouse gas concentrations as a tool of advocacy.
You can watch the full discussion here:
S7 Ep3: Extreme Weather part 1 | Our experts dig through IPCC data to reveal surprising trends in extreme weather.
S7 Ep4: Extreme Weather part 2 | Floods, fires and storms are flat or down, but risk and damages have increased.
Additionally, we received 24 questions beforehand (many of which had to be cut due to time constraints in the episode). I have provided written responses with references/links that viewers seeking more detail may find helpful.
1) Why should our viewers care about extreme weather and its connection to climate?
Extreme weather is consequential: it costs global society about 0.2% of global GDP annually (ref.), causes 20 million people to be forced to move annually (ref.), and still causes 10s of thousands of deaths annually (ref.).
We only hear about and care about extreme weather because societies are exposed to them (there are people and structures in harm’s way) and are vulnerable to them (these people and structures can be adversely impacted by the weather) (ref.).
We should care particularly about the connection to climate change when elevated greenhouse gas concentrations have a very clear direct relationship with changes in the extreme weather, like in the case of hotter heatwaves (ref.), milder cold waves (ref.), and higher coastal flooding (ref.) due to higher sea levels.
Most of the motivation to facilitate continued decreases in vulnerability is independent of changes in extreme weather (ref.): it is not necessary for hurricanes to be worsening to want to reduce our vulnerability to them.
2) What’s the difference between climate and weather?
The climate is the average and typical variability of all weather variables at any given place (ref.).
Elevated greenhouse gas concentrations and the warming that results from that affect all weather to some degree.
Contemporary climate change generally refers to how those averages and variability are being affected by elevated greenhouse gas concentrations, and we observe this by tracking changes in weather statistics over the long term (ref.).
3) Let’s start with a recent event, the Hurricane Helene flooding in NC. What happened?
Summary
In North Carolina, heavy rainfall in the days and weeks leading up to the event and topographically enhanced rainfall rates (Total 2-day rainfall estimates were in the range of 12 to 20 inches in a large swath of western North Carolina (ref.)) led to severe flooding, causing $60 billion in damage (ref.) and killing 230 people (ref.) (making it the deadliest US hurricane since Katrina).
Hazard change
The rainfall from Hurricane Helene was made about 10% more intense due to the warming since the Industrial Revolution (ref.), so places that saw 20 inches would have seen 18 inches in a preindustrial climate.
The flooding was very likely enhanced by warming, but that does not make this flood unprecedented in recorded history - floods in 1791 (ref.) and 1916 (ref.) were comparable in severity.
Exposure change
The population exposed to floods is increasing: Since the 1916 flood, the population of North Carolina has increased by over 300% (ref.), and there has been substantial housing development in the hills that experienced mudslides (e.g., Buncombe County) since the 1980s (ref.).
Vulnerability
Bad
Aspects of the situation that made North Carolina more vulnerable than an ideal situation were aging and deteriorating water infrastructure; the US Army Corps of Engineers had previously classified 39% of the region’s dams as only in fair, poor, or unsatisfactory condition (ref.).
Flooding occurred in a region with a large number of less resilient trailer homes and manufactured homes (ref.).
Good
Standard disaster preparation and response should not be taken for granted, as they demonstrate many of the reasons that high-income societies are so much less vulnerable to extreme weather than they used to be and why they are less vulnerable than low-income places today (ref.).
The flooding was very well forecast many days in advance, which allowed for effective evacuations and allowed for the prepositioning of many disaster resources, such as rescue teams, emergency vehicles, and supplies like fuel, food, water, cots, and blankets (ref.).
The Humane Society was active in providing shelter, supplies, and veterinary services for pets (ref.), which demonstrates the luxury of resources in modern high-income countries compared to the past and to lower-income countries in the world today (ref. ref.).
4) For viewers who don’t know, what is the IPCC? Can we trust their science?
The IPCC
The core of the Intergovernmental Panel on Climate Change is a group of academics and scientists who, on a part-time basis, synthesize the scientific literature on climate change in major reports released about every six years (ref.).
Working Group I focuses on physical climate science, including extreme weather, Working Group II focuses on impacts and adaptation, and Working Group III focuses on emissions reductions (ref.).
Trustworthiness
The UN IPCC is intertwined with the UNFCCC treaty, whose goal is to “avoid dangerous anthropogenic interference with the climate system,” and thus, it takes as its goal to reduce human impact rather than optimize human well-being.
The IPCC does not do a holistic assessment of the costs and benefits of various energy and agricultural systems, but instead is oriented around the negative impacts of elevated greenhouse gas concentrations (ref.) and pathways to reduce greenhouse gas emissions.
Working Group I is pretty even-handed (the rest of this document references it extensively) but has a slight negativity bias, and high-level summaries can oversimplify.
Working Group II has a major negativity bias, often taking positive situations, such as the dramatic increase in crop yields over time or the decrease in human deaths from extreme weather over time, and constructing conclusions that suggest things are getting much worse over time (ref. ref.).
5) How can we be confident that the climate is warming? How much of it is human-caused?
The climate is warming
A consensus of measurements (ref.)
We can measure warming in the atmosphere with a global network of meteorological stations, with satellites, and with weather balloons.
We can measure warming in the ocean with ships, buoys, networks of floats, and satellites.
We can measure melting ice with satellites.
We can measure rising sea levels with satellites and tide gages.
Human contribution (ref.)
The best estimate is that all of the global warming since the industrial revolution is caused by elevated greenhouse gas concentrations from human activities because the main natural drivers of global climate change on these timescales (changes in solar activity and changes in volcanic activity) should have caused no change or slight cooling since the industrial revolution.
6) In a warming climate, does the IPCC show more heat waves? Where, with what effects?
Heatwaves
The easiest way to conceptualize contemporary climate change is that all temperatures everywhere are warmer (over land, about 2°C or 3.6°F warmer), so heat waves are warmer, cold waves are warmer, and unremarkable temperatures are warmer than they would have been without elevated greenhouse gas concentrations (ref.).
If a recent day was 105°F, a day with the same weather setup in a preindustrial climate would have been closer to 101°F.
Heatwaves over land are warming more slowly than cold waves, so it’s not the case that heatwaves are becoming disproportionately hotter than other less remarkable temperatures (ref.).
Effects
The two most prominent societal impacts of heatwaves are probably their detrimental impacts on crop yields (which is contested, ref.) and human mortality (ref.).
Reductions in vulnerability have far outpaced increases in the heatwave intensity, and thus, the result has been improving outcomes over time: increasing crop yields (ref.) and decreasing human mortality rates (ref.).
7) Is warming impacting precipitation patterns and amounts? Where and with what effects?
Patterns and amounts
Fundamental theory tells us that annual mean precipitation should increase by about 2% per 1°C (1.8°F) of warming and that extreme precipitation (daily, hourly rain rates) should increase by about 7% per 1°C (1.8°F) of warming (ref.).
Observed changes in global annual mean precipitation are not apparent yet (ref.), and local trends vary by location, with some locations showing increases and other locations showing decreases (ref.).
Observed changes in extreme daily precipitation are appearing, with 9% of global stations showing statistically significant positive trends and 2% showing statistically significant negative trends (ref.). 89% of stations have not reached the threshold of statistical significance because the noise of natural weather variability is much larger than the signal induced from background warming (ref.).
Effects
Precipitation affects floods and droughts (more below)
8) Do we see trends in storms, hurricanes, and/or cyclones? What are they?
Short answer: No
Hurricane hazard
We do not observe clear trends in measures of global hurricane occurrence or wind speed over the past several decades (ref.). However, models suggest that hurricane wind speeds should increase at a rate of approximately 2.5% per 1°C of warming (ref.).
There is good evidence of decreasing hurricane occurrence since the 1800s (ref.)
When hurricanes do occur, they tend to produce approximately 10-15% more rainfall (ref.) and generate storm surges about 8% larger than similar storms in the 1800s (sea level has risen 9 inches since 1880 (ref.), and a medium/large storm surge is around 10 feet (ref.).
Hurricane exposure and vulnerability change
We see disproportionate growth in population and economic value exposed to hurricanes on the coast (ref.), but at the same time, modern technology, infrastructure, and building codes can drastically reduce vulnerability (ref.) in terms of proportional damage done, and lives lost (e.g., cyclone-related mortality in Bangladesh has declined by more than 100-fold over the past 40 years ref.).
Mid-latitude cyclone (low-pressure system) hazard
Fundamental theory tells us that reduced equator-to-pole temperature differences weaken the potential energy these systems tap into and result in a reduction in their wind speeds (ref.), and we do observe that and project it to continue (ref.), but we still expect to see an increase in the most extreme daily rainfall rates of 7% per °C (ref.).
The reduction in wind speeds, combined with an energy system more reliant on wind, introduces a new type of extreme weather that was not consequential before: the wind drought (ref.).
Mid-latitude cyclone (low-pressure system) exposure
The US population has risen more than 200% in the last century (ref.), so many more people than ever before are exposed to the negative impacts of mid-latitude cyclones.
Storms: Severe Thunderstorms.
Tornado hazard
In the US, accounting for reporting biases, historically observed trends in tornado counts vary by location, with some locations showing increases and others showing decreases; however, there is no overall change, and a decrease in the most severe tornadoes may be observed (refs. wherein).
Projections suggest a 5% increase in U.S. supercell-hours (a proxy for the tornado threat) under 3°C of warming (refs. wherein).
Hail hazard
In the US, historically observed trends vary by location, with some locations showing increases and other locations showing decreases (refs. wherein).
Projections indicate that there will be increased hail formation in clouds, but falling through a warmer atmosphere will cause increased hail melting on the way down, resulting in uncertain future change (refs. wherein).
Severe thunderstorm exposure and vulnerability change
In the US, the number of structures and population exposed to severe weather has increased by 400% since 1940, but at the same time, increases in structural quality and forecasting have drastically reduced the loss of life from severe weather (refs wherein).
9) Do we see trends in droughts? In floods? What are they?
Short answer: No
Drought hazard
Historically observed trends in droughts vary by metric and location, with some locations exhibiting increases and others showing decreases (ref., ref.).
There are not historical observed trends in global metrics of droughts like surface soil moisture, though there appears to be a modest increase in the amount of area under drought as defined by some metrics like the Palmer Drought Severity Index (ref.).
Projections suggest some locations should experience an increase in drought as measured by surface soil moisture, and other locations should experience a decrease in drought, and these changes are locally on the order of 2% per 1°C of warming (ref.).
Flood hazard
More locations show observed increases in extreme daily precipitation than decreases (ref.), and the expectation is that the most extreme maximum daily precipitation over land should increase by about 7% per °C of global warming (ref.).
Decreased winter snowpack decreases rapid spring melt floods, and the greater capacity of drier soils to soak up water potentially offsets this increase in extreme precipitation such that there has been little observed nor projected increases in floods as quantified by annual maximum streamflow (refs. wherein).
Projections indicate that some locations should expect increases and others should expect decreases, and overall, under a constant population scenario and current flood protection, the percent of the global population exposed to flooding increases from 2.2% annually to 3.2% annually under 3°C (5.4°F) of warming (ref.).
Exposure and vulnerability change
Globally, the number of structures exposed to floods has increased 400% since 1985 (partially because population growth in risky areas even outpaces background population growth), but at the same time, flood control systems work, and lives lost from floods have seen a dramatic decline (refs. wherein).
When it comes to flood impacts (or any type of extreme weather), the vast majority of people would rather live in a modern industrialized world with both the warmed climate and the flood protection that comes with it than live in a preindustrial world with a cooler climate and without the flood protection.
10) Do we see trends in wildfires and weather that encourages them? What are they?
Weather that encourages them
We have seen a global increase in the metrics designed to measure weather conducive to wildfires (like fire weather season length and the intensity of the Fire Weather Index) due to warming causing drying, and in spite of reduced extreme winds in many locations (ref.).
Wildfires
Globally, we have observed a decline in fires over recent decades as measured by both area-burned (ref.) and mass-burned (ref.).
Much of the observed decline is due to many historically fire-prone savannas in Africa being converted to farmland and grazing land (though there is some agricultural burning, the net effect has been a decrease in fire activity) (ref.).
Even in locations of high concern where fire activity has increased over recent decades, like the Western US and California, fire activity remains well below where it was hundreds of years ago (ref.).
Globally, the effects of ignitions, land use, and land management can and have overwhelmed the effects of climate change (ref.).
Wildfire exposure
California’s population has increased by 200% since 1960, so that’s many more people to light fires (ref.) and many more structures to burn down.
There has been a 60% increase in structures in the wildland-urban interface in the US West over the past 30 years (ref.).
11) Are these weather and extreme weather events outside historical norms?
Extreme weather happens infrequently by definition, and we only have very high-quality observations for a lot of weather events in the satellite era, which started around 1980 (45 years).
Fuzzier pictures can be estimated further back in time, and when we do that, most things we see today are not without precedent.
Warming may well be increasing the intensity of many types of extreme weather. Still, the signal from warming is much smaller than the noise of natural variability (ref.). Thus, we tend not to see obvious trends in extreme weather (ref.) the way we do with, e.g., CO2 concentrations (ref.) or global average temperature (ref.).
What is certainly outside of historical norms is reduced societal vulnerability to extreme weather.
12) To recap, which weather events show correlation to warming today, and which do not?
Elevated greenhouse gas concentrations and the resulting warming affect all weather to some degree, but the direction of change often depends on the location and is sometimes contested.
The extreme weather that we can most confidently connect to background warming are warming of extreme heat (by 2°C over land, ref.), warming of extreme cold (by more than 2°C over land, ref.), increases in the height of coastal flooding due to sea level rise (9 inches since 1880, ref.) and increases in extreme daily precipitation (10% higher, ref.).
Floods, droughts, tropical cyclones, extratropical cyclones, severe thunderstorms, and wildfires are much more complicated, with both historical observations and projections not indicating a universal direction of change (ref., ref.).
13) Is correlation causation? What else could be driving changes besides warming?
Locally, trends in a lot of extreme weather can be dominated by natural random unforced variability (e.g., El Niño, La Niña cycles, Atlantic Multidecadal variability, Pacific Decadal Variability) on decade-to-decade timescales (ref.).
Extreme heat (ref.), extreme cold (ref.), wildfires, and floods are all affected significantly by local land use.
In terms of societal outcomes (e.g., crop yields, water availability, death rates, malaria rates), there are almost always much bigger drivers of change than climate change (ref.).
14) Do other climate scientists and climate advocates agree with the IPCC on weather?
There is a large gap between the messaging of IPCC WG1 Chapter 11 on extreme weather (especially the sections on observations) and the message conveyed by those in the so-called climate movement who see the connection between elevated greenhouse gas concentrations and weather disasters as the main tool in their toolbox to drive political change (ref.).
15) What do mainstream journalists say about extreme weather?
Presently, since climate change has become a part of the culture war, sources such as The New York Times (ref., ref., ref.), LA Times (ref.), and The Guardian (ref.) have a tendency to cover all bad weather through the lens of climate change.
Interestingly, the Los Angeles Times does not have a weather tab in its top navigation bar, but they do have a climate tab (ref.). Climate change is slow on human timescales, so as a news organization with a mandate for high-frequency coverage, that structural choice pre-commits the organization to covering basically all dramatic weather through a climate lens, even when the influence from elevated greenhouse gas concentrations is small and contested.
Journalists will often use phrases like “climate-driven,” “climate-fueled,” or “supercharged by climate change,” where they leave out the actual size of the effect they are claiming, and the result is that the language greatly exaggerates the magnitude of the changes we are seeing.
A particularly egregious example of this is when coverage explicitly contradicts the mainstream consensus, as represented by the IPCC, such as when extreme cold is portrayed as becoming more extreme rather than milder (ref.).
16) Should journalists be saying something else? What should the public know?
What you’re seeing is largely the preexisting extreme weather of Earth’s climate, in some cases enhanced from its 19th-century versions, interacting with a vastly expanded amount of society exposed to this weather, amplified by the much more efficient dissemination of disaster coverage via the internet and algorithms. What tends to be left out is the vast decrease in vulnerability in terms of economic loss per unit of value exposed and lives lost per person exposed (ref.).
Journalists should report that extreme weather-related outcomes are driven much more by societal arrangements and economic development than they are by the severity of the extreme weather.
Journalists should be more honest about how fossil-fueled technological and economic development are responsible for the tremendous declines in vulnerability that we’ve seen and thus honestly report on the potential negative consequences of overly restrictive energy policies, especially for low-income countries.
17) What is attribution science? Why was it created, and how does it look at events?
Attribution science
Attribution science attempts to quantify what aspects of some observed weather or climate phenomena can be attributed to elevated greenhouse gas concentrations (ref.).
Attribution necessarily entails that you construct a counterfactual, typically with a climate model: What would things look like had greenhouse gas concentrations not been elevated above their preindustrial levels (ref.)?
Running physics-based climate models, with and without greenhouse gas enhancement, tells us that we can be very confident that we can attribute observed global warming to elevated greenhouse gas concentrations (ref.).
The same logic can apply to extreme weather at specific locations. But, there is much more uncertainty because the signal of climate change is small compared to the noise of natural variability. Thus, you are often making attribution statements without having observed trends in the weather phenomena (i.e., without having detected any climate change (ref., ref.).
Regardless, extreme weather event attrition studies, like those conducted by World Weather Attribution, tend to show intensity changes in the range of -10 to 25%. For example, World Weather Attribution calculated that during the January 2025 LA wildfires, the Fire Weather Index was enhanced by 6% (ref.), and during Hurricane Helene, the rainfall was about 10% heavier (ref.) due to elevated greenhouse gas concentrations.
Why was it created?
The originally stated motivation was to be able to credibly sue fossil fuel companies (ref.), and that motivation still animates many in the subfield today (ref.), according to their public statements (ref.).
18) It seems like the range of temperature forecasts by the best models in the world is still very significant. Is it possible to attribute some portion of a weather event to human-caused climate change, given that uncertainty?
Many times, there is not a model consensus on the direction of change, so you might have 20 models (which are not independent), and 15 say warming increased the intensity of this event, and 5 say warming decreased its intensity (ref.) and it’s a subjective value judgment whether that is sufficient evidence for you to believe that warming increased its intensity. That uncertainty is rarely communicated in the media.
19) Are some institutions and the media relying on attribution science? Why?
The climate movement finds extreme event attribution very useful from a messaging standpoint. A lot of this reporting is funded by environmental philanthropy and catering to audiences that share those environmental commitments (ref.).
Stepping back, we’re talking about something like 3°C warming this century when there is, for example,
A 30°C difference between the coldest and warmest country capitals in the world (ref., ref.).
A 20°C difference between winter and summer temperatures for mid-latitude cities (ref.).
A 20°C difference between the current global temperature and some of the warmest periods in Earth’s history, like that of 100 million years ago (ref.).
A 20°C local difference between mid-latitude temperatures in, e.g., St. Louis and what they were in the Last Glacial Maximum 20,000 years ago (ref.).
A 4.5°C difference between Boston and Philadelphia (ref., ref.).
A 1-2°C difference between urban and rural areas within the metros of large cities.
There has always been a tacit conversation that goes, “3°C doesn’t sound like that much; how can we help people understand that it is?” (With the assumption that 3°C just has to be large). Connecting elevated greenhouse gas concentrations to more extreme weather, even if the effect is small in magnitude, and/or somewhat tenuous, is perceived to accomplish this goal (e.g., the hurricane coming out of the smokestack on the cover of An Inconvenient Truth) (ref.).
You can see this in the way the media reported on the LA fires. World Weather Attribution came out with their analysis saying that the Fire Weather Index was 6% higher, and you get headlines like “Yes, you can blame climate change for the LA wildfires” (Science News, ref.). The same analysis could have been used to support a headline of “Climate change a minor factor for the LA wildfires.”
Some politicians like attribution science because it puts the blame elsewhere and diverts attention away from local failures of disaster preparation or management.
Some industries like attribution studies, like Climate Service Providers (CSPs) that use them to sell their information, and the insurance industry that can use them to justify increased premiums.
20) Is there a more valuable way to measure the impact of weather events? (damages)
Noting increases in absolute damages and implying that this is because the weather is becoming more severe is blatantly misleading because increases in damages are caused primarily by increases in value exposed (ref.).
Both human and economic vulnerability are declining dramatically - global average mortality and economic loss rates have dropped by 6.5 and nearly 5 times, respectively, from 1980–1989 to 2007–2016 (ref.).
The drop in economic loss rates is very intuitive when you think about it: a trailer home or a poorly constructed home in a low-income country might get completely destroyed by an extreme weather event, whereas if there were larger, more valuable, more resilient homes, they might incur more absolute damage but less damage as a proportion of the value exposed.
100% damage on $20 of value is only $20, whereas 50% damage on $100 of value is $50.
21) What are the factors increasing damages from weather events?
Exposure growth dominates, both in the background population growth and disproportionate growth in high-risk areas (ref.).
For the vast majority of extreme weather, intensity changes are calculated to be on the order of -10 to +20%, whereas the change in exposure is often on the order of an increase of +100% to +400% over the past 50 years. Exposure change tends to be 10 to 100 times larger than physical changes in the weather.
22) Should this understanding of weather and damages influence our response to climate?
First, trying to influence extreme weather outcomes with energy policy is incredibly indirect and delayed (ref.).
Focusing on changes in extreme weather can distract from more direct on-the-ground solutions that have to do with mitigating increases in exposure and facilitating continued decreases in vulnerability to extreme weather generally (ref.).
We can mitigate increases in exposure by smarter zoning and allowing insurance premiums to reflect real risk (not artificially suppressing premiums).
We can facilitate continued decreases in vulnerability globally by encouraging economic development in low-income countries (refs. wherein), which does entail increasing greenhouse gas emissions in the near term (ref.).
23) Final thoughts?
In the absence of some very sci-fi future with supreme geoengineering, extreme weather is inevitable, but the evidence suggests that economic development will continue to decrease vulnerability faster than extreme weather is changing.
Outcomes are dictated much more by the economic and technological capabilities of societies than they are by the severity of the weather: Mortality from extreme weather has declined radically over time, and it is many times higher for low-income countries than for high-income countries (ref.).
Most of the motivation to continue to foster decreased vulnerability is independent of changes in extreme weather (ref.). I am not sure it matters much in terms of decisions whether the rainfall from Hurricane Helene was made 10 or 25% more intense or whether it made tropical cyclones, in general, become more or less likely.